Lab 9: Dictionaries, Defining Classes, and Generating Graphs
Goals
After the lab, you should be proficient at
- using dictionaries to solve problems
- creating and testing your own classes from a specification
- developing a larger program using a class to solve a problem
- using a common third-party library to generate graphs
Objective: Review
Review the slides for today's lab.
Objective: Set Up
- Run labhelp
- Copy
/csci/courses/cs111/handouts/lab9and all of its contents (which means what command-line option should you use?) into yourcs111directory. - Copy
test.pyfrom yourlab8into yourlab9directory.
Objective: Programming in Python
We'll practice writing several Python programs, each in their own text file. Name the files, as usual.
Your programs will be graded on correctness, style, efficiency, and how well you tested them. Make sure you adhere to the good development and testing practices we discussed in class. Your code should be readable and your output should be useful and well-formatted.
- (10) Create a program that maps a letter to an example word that
starts with that letter using a dictionary object.
- You must have at least three entries in your dictionary and you should add them not in alphabetical order (for example, reverse alphabetical order or in a random order).
- Then, print out the dictionary so that it looks similar to a children's book, and the keys are printed in alphabetical order.
Children's Book Favorites:

f is for fiddle
g is for goose
z is for zoo
This is meant to be a simple warm up problem to get you using dictionaries. There is no input.
- (25) The most common last names for people in the United States
are Smith, Johnson, and Williams. (Source: US
Census) The most common first names for females over the last
100 years are Mary (by a lot!), Patricia, and Jennifer and for males are
James, Michael, and John.
(Source: Social
Security Agency)
In this program, you are going to count how many times each name occurs among W & L students.
- Your program will read in a text file of names (one name per
line), count how many times each name occurs in the text file,
and print out the names (in alphabetical order) and the number
of times each name occurs. (Note that this problem is simpler
than the problem we solved in class because we know that the
only information on a line in the file is the name.)
There are five data files in the
datadirectory for you to process. Filedata/test.txtis provided as an easier first file to test. The remaining four files represent W&L undergraduate's last names, first names, female first names, and male first names.Execute your code on one data file. Start with
data/test.txt. Determine what the expected results are first. Then, check if your code worked. Later,data/lastnames.txtfile will be the easiest data file to use to check if your work is correct because the file is in alphabetical order. - Add (and update as appropriate) the following code to your
code to enable some "spot checks" for correctness.
      name = input("What name do you want to check? (hit enter to exit) ")
      while name != "":
          if name in name_to_count:
              print(name, "occurs", name_to_count[name], "times.")
          else:
              print(name, "was not in the data.")

          name = input("What name do you want to check? (hit enter to exit) ")
Hit enter to exit the
whileloop. - To make development a little simpler later in the lab, refactor
your code so that you have a function that takes the name
of the file (a string) as a parameter. The function should process
the file and return the generated dictionary. The
mainfunction should contain the remainder of the code, including displaying the (alphabetized) contents of the returned dictionary.You can remove that
whileloop used to test with user input at this point. - Finally, modify your
mainto call the function five times, once for each of the data files. (When you hear "for each of", you should think to use what?)Don't save the output from this program--it's too much to print! Just look at the output yourself and verify that it makes sense.
While this is useful output, we can't easily determine the name that occurs most frequently, and we can't see trends in names' frequencies. Which leads us to...
- Your program will read in a text file of names (one name per
line), count how many times each name occurs in the text file,
and print out the names (in alphabetical order) and the number
of times each name occurs. (Note that this problem is simpler
than the problem we solved in class because we know that the
only information on a line in the file is the name.)
- (25) The reason we can't get the output we want from the
previous program is because we can't tie the name and the number of
occurrences together. We want to sort by the number of
occurrences, but, given the number of occurrences, we can't
look up the name that has that number of occurrences. When
we want to package and encapsulate data (and functionality)
together, that calls for a new data type!
We will tie this class into the last program in problem 4. For now, just focus on implementing this class.
To address this issue, we will create the
DataFrequencyclass. The filefreq.pythat partially implementsDataFrequencywas provided for you when you copied thelab9directory at the beginning of lab. Complete the implementation in this file.The following specifies the class's attributes and methods:
Attributes/State:
- a string that represents the "thing" being counted (let's call that the data)
- a count that represents the number of times that the data occurred
Functionality:
- constructor - doesn't return anything. (Constructors never return anything.) Takes as a parameter a string representing the data to be counted. Initializes the object's data, setting its count to 1. What is the method name associated with the constructor?
- string representation - returns a string that has the format:
data
      count
What is the method name associated with this method? getData()- returns the DataFrequency object's datagetCount()- returns the DataFrequency object's countincrementCount()- increments the DataFrequency object's count by 1 (does not return anything)setCount(count)- sets the DataFrequency's count to the given parameter (does not return anything)
Exercise and Test the Class
Let's start by making sure that you understand how to use the class and how it's supposed to work, based on the documentation. Follow the examples in the
mainand test functions in the Card class to programmatically test this class.- In main, create two
DataFrequencyobjects and print those objects. - In testFrequencyData, write tests of the
__str__method, usingtest.testEqual
Complete Implementation of the Class
- Complete the implementations of
getData()andgetCount() - Test that those methods work.
- Test that
incrementCount()works. Note thatincrementCount()is a mutator method that does not return anything, so how can you programmatically test it? - Implement and test
setCount(count).
For your output file, show your exercising of the code and that your tests work. The output will likely not be very interesting.
- (25) Putting it all together. In this program,
you will use your
DataFrequencyclass to generate the name frequency results that can be used by another Python program to generate graphs.- Copy the second program for this problem. Remove
the
whileloop/input that was used to do spot checks if you haven't already. - Since you're actively developing, change your list to only
have one filename in it (e.g.,
test.txt). - Import all the code from
freq.py. (Recall how we did this back when we were using thegraphicslibrary.) - There are two alternatives for
generating the list of
DataFrequencys to solve the problem.:- (More object-oriented practice) Modify the program so
that the dictionary maps the key (the name) to the value
(the
DataFrequencyobject). When the program sees a name again, update theDataFrequency's count.Then, get the
values(which areDataFrequencys) from the dictionary, which you should then make into alist.OR
- Go through the dictionary,
creating
DataFrequencys from the mappings, setting their counts, and adding them to a list.
If you get "weird" output when you print the list (like output you get when __str__ isn't defined), that's because you're printing out the list as a list. Instead, print out the elements of the list, individually.
- (More object-oriented practice) Modify the program so
that the dictionary maps the key (the name) to the value
(the
- After you have a list of
DataFrequencys:- Sort
the list by the
DataFrequency's count, following the example in the slides and in the example program. The word "key" has different meanings depending on the context. We were using "key" to refer to the data that we were counting. Insort, "key" refers to the criteria we're using to sort the objects. - Reverse the list so that the objects are in the order of greatest to least
- Print out the elements to confirm that is working.
- Write the list to a file, saved in the
datadirectory. The file should be in the following format (does that format look familiar?):<name> <count>
For example, an output file for male first names could look like
James 12
John 9
Robert 7
...
The data above is not the correct values for the W&L data.
- Check your output file to verify that your output makes sense and is in the required format.
- Sort
the list by the
- Change your code to process all of the names files. Your list
will represent the "basename" for both the input and output
files. For example, for the data about last names, the
basename would be
lastnames, the input file would belastnames.txt, and the output file would belastnames.dat.
No output for this program. The graphs you generate in the next section are your output.
- Copy the second program for this problem. Remove
the
Objective: Generating Graphs (8)
Now, we're going to use a Python program to create bar graphs of
the data you generated from your programs
using matplotlib, which is useful for generating lots of
different kinds of graphs.
Run the given generateFreqGraphs.py or
modify graphing_example.py to generate the graphs for
each of your data files. Modifying graphing_example.py
is the easier approach--less chance for user error and less typing if
you need to run multiple times. Don't get fancy. Just generate the 4
graphs. Remember that all the data files and graphs should be in the
data directory.
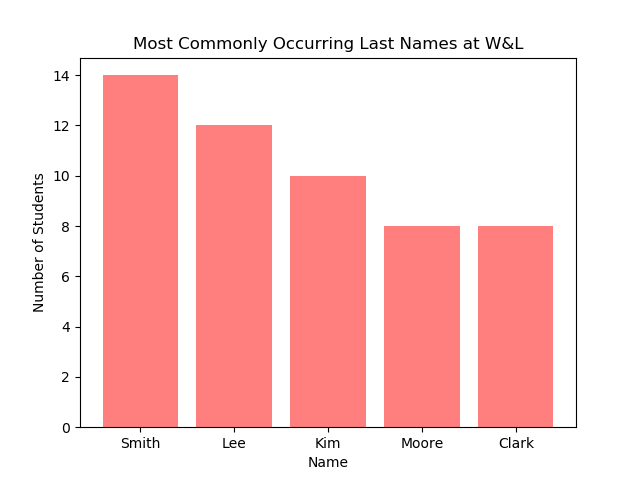
Show the top 5 names for each data file. In the case of a tie for the 5th ranked name (only), show all the tied results.
Example generated graph, showing 6 entries because of ties for the
5th most frequent last name:
Objective: Creating a New Web Page (7)
Objective: Copying Images to Web Server
- Open a new terminal. We want one terminal to be on a lab machine. The new terminal is going to be on the computer science department's web server.
- Go into your
cs111/lab9/datadirectory. Copy all of your graph images from the lab machine to the computer science department's web server using:scp *.png username@cs.wlu.edu:public_html - ssh into the computer science department's web server using
ssh -XY cs.wlu.eduYou don't need to include your username because it's the same as the username on the lab machine.
You are now in your home directory of the web server. View the contents of your home directory. You should see your
public_htmldirectory that you created in a previous lab. - Go into your
public_htmldirectory. - Confirm that you copied your images into this directory. (How?)
Creating a Web Page
- Confirm that you are in your
public_htmldirectory. - Copy your
lab2.htmlorindex.htmlfile to a file calledlab9.html(in thepublic_htmldirectory).
Review the copy command if necessary. - Modify the Lab 9 web page (using emacs) to have an appropriate, title, heading, and information.
- Modify your Lab 9 web page to display the graphs you created.
To change the size of the images you can use the
widthattribute to make the graphs be a certain width in pixels, e.g.,width=500 - In the text at the top of the page, discuss what met your expectations and what surprised you about the data/graphs/results.
- Modify your
index.htmlpage to link to your Lab 9 web page.
Note: Do not display the "old" images from the original index.html or lab2.html pages. Your page should only contain content about this week's lab.
Finishing up: What to turn in for this lab
Carefully, remove any graph files (*.png) files that were accidentally saved in the
lab9directory; otherwise, you'll get an error when creating the output file. Also, remove any output data files that were accidentally written tolab9instead oflab9/dataNote that each command links to a page with more information about using the command.
- Create the printable lab assignment, using the
createPrintableLabcommand. - View your file using the
evincecommand. - Check that the PDF contains all (and only) the necessary files.
- Print the file from evince. You can print to other printers if there are issues with the computer science printers (which do not cost you anything to print computer science work).
- Submit
your lab directory into your
turnindirectory. - Log out of your machine when you are done.
Labs are due at the beginning of Friday's class. The
electronic version should be in
the turnin directory before
class on Friday.
Ask well before the deadline if you need help turning in your assignment!
Grading (100 pts)
- Python programs: 85 pts; see above for breakdown
- Graphs: 8 pts
- Web pages: 7 pts (both your index.html page and the lab9.html page)