Lab 9: Dictionaries, Object-Oriented Programming, and Creating Graphs
Goals
After the lab, you should be proficient at
- using dictionaries to solve problems
- creating and testing your own classes from a specification
- developing a larger program using a class to solve a problem
- using a common third-party library to generate graphs
Objective: Review
Review the slides for today's lab.
Objective: Set Up
- Run runHelpClient &
- Copy
/csdept/courses/cs111/handouts/lab9and all of its contents (which means what command-line option should you use?) into yourcs111directory.
Objective: Programming in Python
Your programs will be graded on correctness, style, efficiency, and how well you tested them. Make sure you adhere to the good development and testing practices we discussed in class. Your code should be readable and your output should be useful and well-formatted.
- (10) Using a dictionary object, create a program that maps a
letter to an example word that starts with that letter. You must
have at least three entries in your dictionary. Then, print out
the dictionary so that it looks similar to a children's book, and
the keys are printed in alphabetical order. Example output looks
like:
f is for fiddle
g is for goose
z is for zoo
- (20) The most common last names for people in the United States
are Smith, Johnson, and Williams. The most common first names for
females are Mary, Patricia, and Linda and for males are James,
John, and Robert.
(Source: Name
Statistics) In this program, you are going to determine the
most common names for W & L students.
Your program will read in a text file of names (one name per line), count how many times each name occurs in the text file, and print out the names (in alphabetical order) and the number of times each name occurs. (Note that this problem is slightly simpler than what we did in class because we know that the only thing on the line is the name.)
There are five data files in the
datadirectory for you to process. Filetest.txtis provided as an easier first file to test. The remaining four files represent W&L undergraduate's last names, first names, female first names, and male first names.Implement your code on one file. (The
lastnames.txtfile will be the easiest "real file" to check that your work is correct because the file is in alphabetical order.)You can add the following code to your code to enable some "spot checks" for correctness. Note: the code may need to be modified slightly, depending on how you named variables.
      while True:
          name = input("What name do you want to check? ")
          if name in nameToCount:
              print(name, "occurs", nameToCount[name], "times.")
          else:
              print(name, "was not in the data.")
Hit Control-C to exit the
whileloop.Next, to make later development a little simpler, refactor your code so that you have a function that takes the name of the file (a string) as a parameter. The function should process the file and return the generated dictionary. The
mainfunction should then display the (alphabetized) contents of the returned dictionary.Next, modify your
mainto call the function four times, once for each of the data files.Don't save the output from this program--it's too much to print! Just look at the output yourself and verify that it makes sense.
While this is useful output, we can't easily determine the name that occurs most frequently, and we can't see trends in names' frequencies. Which leads us to...
- (30) The reason we can't get the output we want from the previous program
is because we can't tie the name and the number of occurrences together. We
want to sort by number of occurrences, but, given the number of occurrences,
we can't look up the name that has that number of occurrences. When we
want to package and encapsulate data together, that calls for a new data
type.
We will tie this class into the last program in problem 4. For now, just focus on implementing this class.
To address this issue, create a
FrequencyInfoclass. The filefreq.pywas provided for you when you copied thelab9directory at the beginning of lab. The following specifies the class's attributes and methods.Data:
- a string that represents the "thing" being counted (let's call that the key)
- a count representing the number of times that the key occurred
Functionality:
- constructor - doesn't return anything. Takes as parameters a
key and a count, and initializes the object's data.
What is the method name associated with the constructor? - string representation - returns a string that has the format:
key
      count
What is the method name associated with this method? getKey()- returns the FrequencyInfo's keygetCount()- returns the FrequencyInfo's countupdateCount()- increments the FrequencyInfo's count by 1
Reminder of Development Process:
You may want to review the
CardandDeckclasses.- Identify the need for a class. (Done!)
- Define the class
- Define the constructor, which intializes the attributes/data the object needs.
- Define the
__str__method - Test the methods you implemented so far.
- Define and test the remainder of the methods (in order of above)
Testing: Write a function that tests your class's methods, similar to the function that tested the Card class's functionality. You don't need to write something like the
testRummyValuebecause this class is relatively simple and doesn't require that level of testing. Your test function (likelymain) should just exercise all the methods and you can manually verify that they are correct. - (25) Putting it all together.
This exercise illustrates how you can use Python to generate graphs. You will use your
FrequencyInfoclass to print out the name frequency results that can be used by another Python program to generate graphs.Copy the second program for this problem. There are two alternatives for leveraging
FrequencyInfos to solve the problem:- (More object-oriented practice) Modify the program so
that the dictionary maps the key (the name) to the value
(the
FrequencyInfo). When the program sees a name again, update theFrequencyInfo's count.Then, get the
valuesfrom the dictionary, which you should make into alistofFrequencyInfos.OR
- Go through the dictionary,
creating
FrequencyInfos from the mappings, and adding them to a list.
After you have a list of
FrequencyInfos:- Sort the list by the
FrequencyInfo's count, following the example in the slides. In this case, the term "key" is overloaded. We were using "key" to refer to the "thing" we were counting. Insort"key" refers to the metric we're using to sort the objects. - Reverse the list so that the objects are in the order of greatest to least
- Write the list to a file, one at a time, in the following
format:
<name> <count>
For example, an output file for male first names could look like
James 12
John 9
Robert 7
...
The data above is not the correct values for the W&L data.
- Save your output files for each input file in the
datadirectory. You should name the summary files appropriately, such asfemale_fnames_freq.dat. (You can name the files either in your program or using Linux commands.) With proper use of functions, you should be able to easily modify the program to handle all four input files at once.
- (More object-oriented practice) Modify the program so
that the dictionary maps the key (the name) to the value
(the
Objective: Generating Graphs
Now, we're going to use a Python program to create bar graphs of
the data you generated from your programs
using matplotlib, which is useful for generating lots of
different kinds of graphs.
Run generateFreqGraphs.py or
modify graphing_example.py to generate the graphs for
each of your data files.
Show the top 5 results for each file type. In the case of a tie, show all the tied results.
Save the graphs in your data
or public_html directory so that the images
do not affect your printing later.
The graphing scripts aren't saving the files as I wanted. So, edit
the code to comment out (or remove) the part that
calls savefig. When you run the script and the graph
pops up, click the save button and save the graph in the appropriate
location.
Example generated graph: 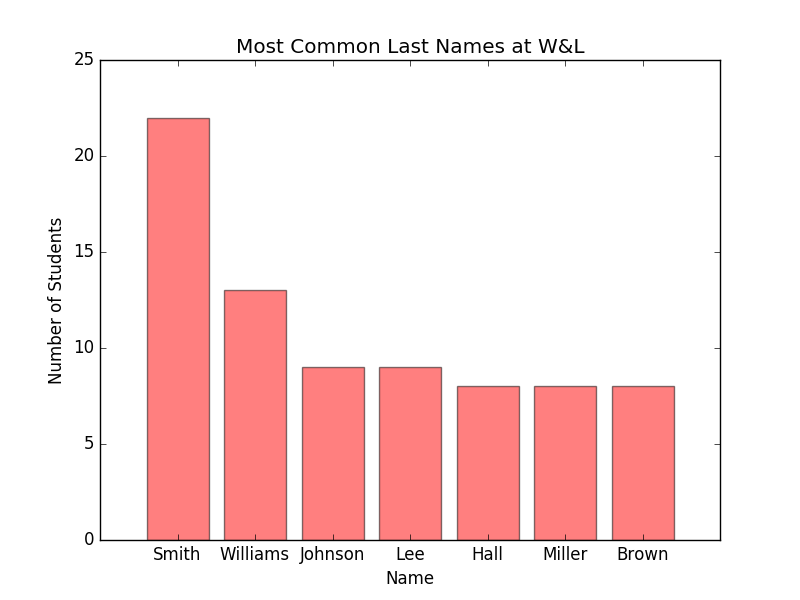
Objective: Creating a New Web Page
- Go into your
public_htmldirectory. - Copy your
lab3.htmlorindex.htmlfile to a file calledlab9.html(in thepublic_htmldirectory).
Review the copy command if necessary. - Copy the graphs you created in the last part into your
public_htmldirectory if they are not already there. - Modify the Lab 9 web page (using jedit) to have an appropriate, title, heading, and information.
- Modify your Lab 9 web page to display the graphs you created.
To change the size of the images you can use the
width=attribute to make the graphs be a certain width in pixels, e.g.,width=400 - Add text labeling each graph separately.
- Note: Do not display the "old" images from the original index.html or lab5.html pages. Your page should only contain content about this week's lab.
- Modify your index.html page to link to your Lab 9 web page.
Extra Credit (up to 10 pts)
Now that we have the Card and Deck classes, you can
write a better game of War or a different card game. You could also update the
Deck class to represent more than one deck of cards.
More complete and difficult games will be awarded more points.
Finishing up: What to turn in for this lab
- IDLE and jEdit may create backup files with the "~" extension. Delete these files from your lab directory to save paper when you print.
- Copy
your
lab9directory into yourturnindirectory. - Remove any .pyc files and any graph files (*.png) files from the directory; otherwise, you'll get an error when creating the output file.
- Create the printable lab assignment, using the
createPrintableLabcommand:
createPrintableLab <labdirname> - View your file using the
evincecommand. - Print the file using
the
lprcommand. - Log out of your machine when you are done.
Perform the following steps from
your cs111 directory.
Note that
each command below links to a page with more information about
using the command.
Labs are due at the beginning of Friday's class. You should
hand in the printed copy at the beginning of class, and the electronic
version should be in the turnin
directory before class on Friday.
Because of Friday's exam, we'll have a staggered extension. You must finish and submit (turnin) the first two problems by class on Friday. You can submit your entire lab by class time on Monday. Keep in mind that there are no student assistants or office hours over the weekend, though.
Ask well before the deadline if you need help turning in your assignment!
Grading (100 pts)
- Python programs: 85 pts; see above for breakdown
- Graphs: 10 pts
- Web pages: 5 pts (both your index.html page and the lab9.html page)